Poll: Biden continues to lead among Augustana students
Democratic presidential nominee Joe Biden continues to lead over Republican incumbent President Donald Trump among Augustana students, according to a recent poll conducted by Elections, Public Opinion and the Media government class between Oct. 8 and 12.
The poll results also showed that most students who responded hold unfavorable views of Trump and mixed views of Biden. Most respondents said personal experience influenced their vote choice the most. In addition, the presidential debate had little impact on voters’ choices, but the vice presidential debate made more of an impact. Finally, COVID-19 response, climate change and economic concerns lead as top issues in students’ eyes.
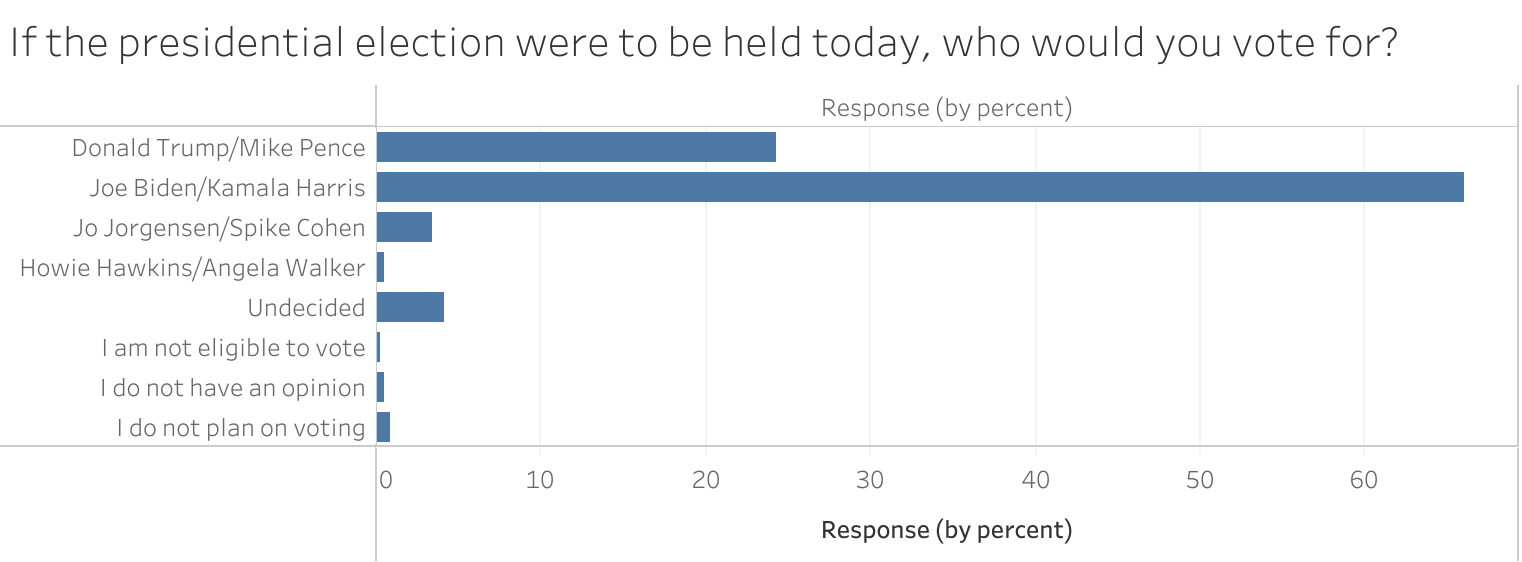
Approximately 66% of the 590 students who responded said if they were to vote on the day that they responded to the poll, they would vote for the Democratic ticket, while more than 24% of respondents said they would vote for the Republican one. The margin of sampling error for all respondents is plus or minus 3.85 percentage points.
A previous poll of campus conducted by the same class between Sept. 25 and 27 found that just over 57% of respondents said that they would vote for Biden and his running mate, Kamala Harris, while exactly 25% said they would vote for Trump and his running mate, Mike Pence.
Most of the poll’s respondents considered themselves Democratic or Democratic-leaning, while about 31% said they were Republican or Republican-leaning. Just under 2% identified as independent.
“People who are Democrats or leaning Democrats are kind of a majority of the people who took this poll,” said Hunter Widvey, one of the students who analyzed data for the poll. “I’d say the Republicans and those who lean to be Republican are in the minority.”
All of the students who identified as strong Republicans said they would vote for Trump, while 83% of moderate Republicans and 48% of Republican-leaning independents supported him. Only 4% of independents said he would have their vote.
“One of the statistics that has really stuck out to me was people who consider themselves strong Republicans were 100% likely to vote for Donald Trump based on the data we had,” said Elizabeth Yoder, another student who analyzed poll data. “I just think that’s really interesting because I think that’s the highest statistic we’ve had on anything.”
About 99% of students who identified as strong Democrats gave their support to Biden. One was not eligible to vote and the other supported Howie Hawkins and his running mate, Angela Walker, who are representing the Green Party.
Over 97% of those who identify as moderate Democrats said that they would vote for their party’s ticket, while just under 90% of Democratic-leaning independents and 66% of independents supported Biden.
No students who identified themselves as strong Republicans or strong Democrats said they would vote for the candidate from the opposing major party. However, 6% of moderate Republicans and 24% of Republican-leaning independents said that they would cross party lines to vote for Biden. Less than 1% of respondents who identified as either moderate Democrats or Democratic-leaning independents showed support for Trump.
Approximately 3% of respondents said they would vote for the Libertarian candidates, Jo Jorgensen and Jeremy “Spike” Cohen, and 0.5% said they would vote for the Green Party ticket. About 4% were undecided, 0.5% had no opinion, 0.9% were not voting and 0.3% were not eligible to vote.
Most respondents view Trump unfavorably, while views of Biden are mixed
Respondents tend to have unfavorable views of Trump, while views of Biden varied.
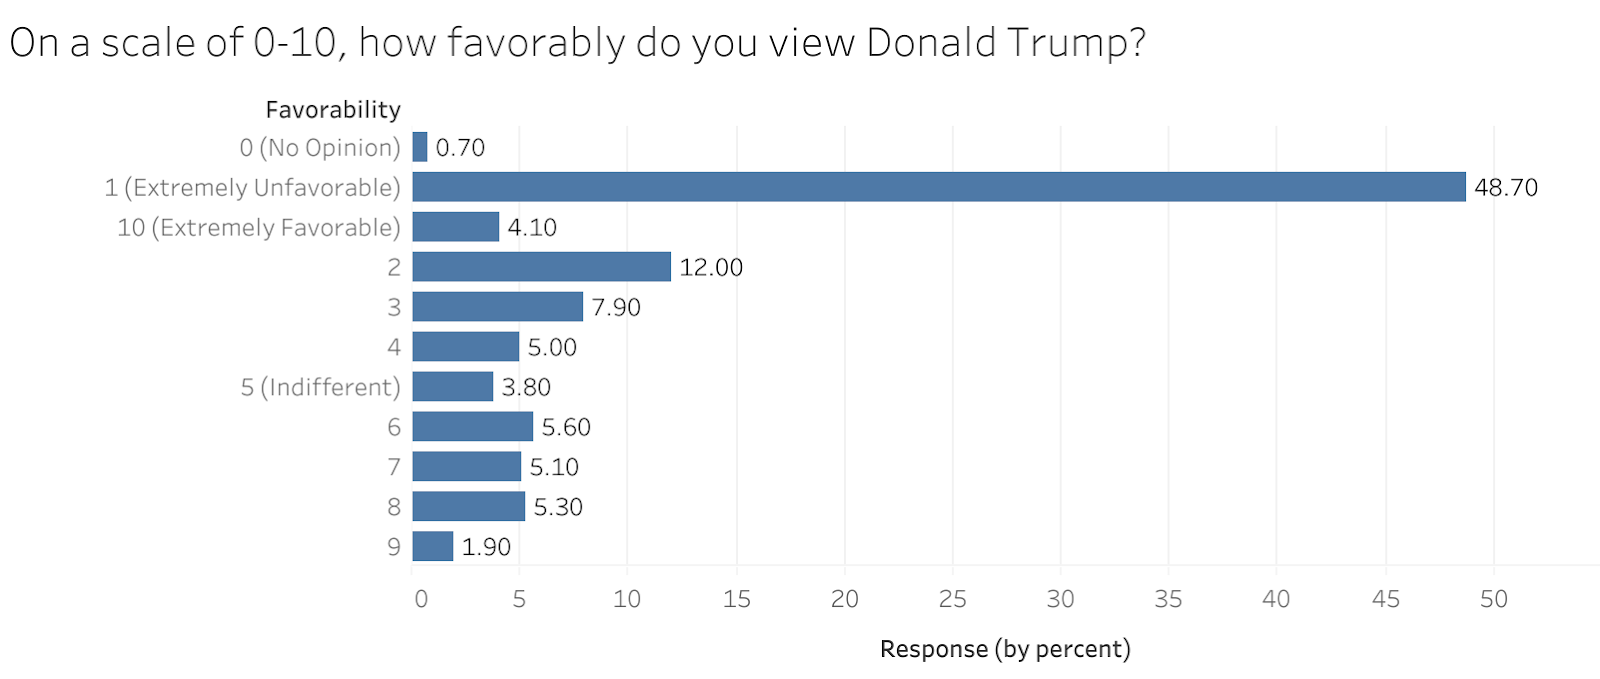
When asked to rate how favorably they view Trump on a scale of one to 10, 48% of students had “extremely unfavorable” views of Trump and chose a one. About 12% chose a two, 7.9% chose a three and 5% chose a four. Just over 4% had “extremely favorable” views of Trump and chose a 10, while 1.9% chose a nine, 5.3% chose an eight, 5.1% chose a seven and 5.6% chose a six. Just under 4% said they were indifferent and less than 1% had no opinion.
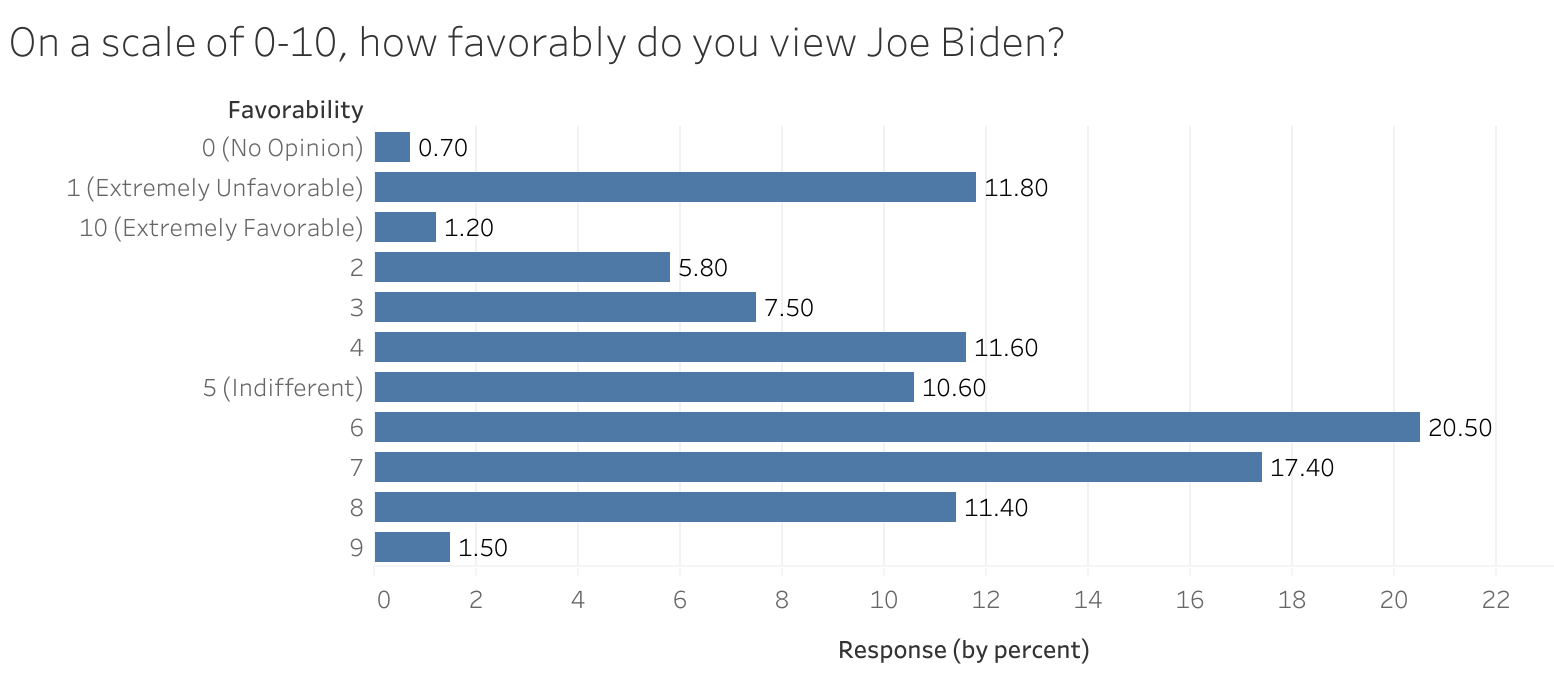
Views toward Biden fell more to the middle of the scale. About 10% were completely indifferent, while 11.6% chose a four, 20.5% chose a six and 17.4% chose a seven.
Those who said that they would vote for Biden were most likely to have unfavorable views of Trump. More than 69% of respondents who supported Biden ranked the favorability of Trump at a one, while 16.06% marked it at two. In contrast, those who indicated support for Trump were more likely to have unfavorable views of Biden. About 38% of Trump supporters marked Biden at one, while 18% selected two.
“People are kind of indifferent or favor [Biden], but they don’t have super strong opinions either way,” Widvey said. “Whereas Trump, you see a ton of people chose ‘extremely unfavorable’ and, then, it kind of spread out from there. And he had a lot of people that kind of ended up clumping together around this extremely favorable and unfavorable thing.”
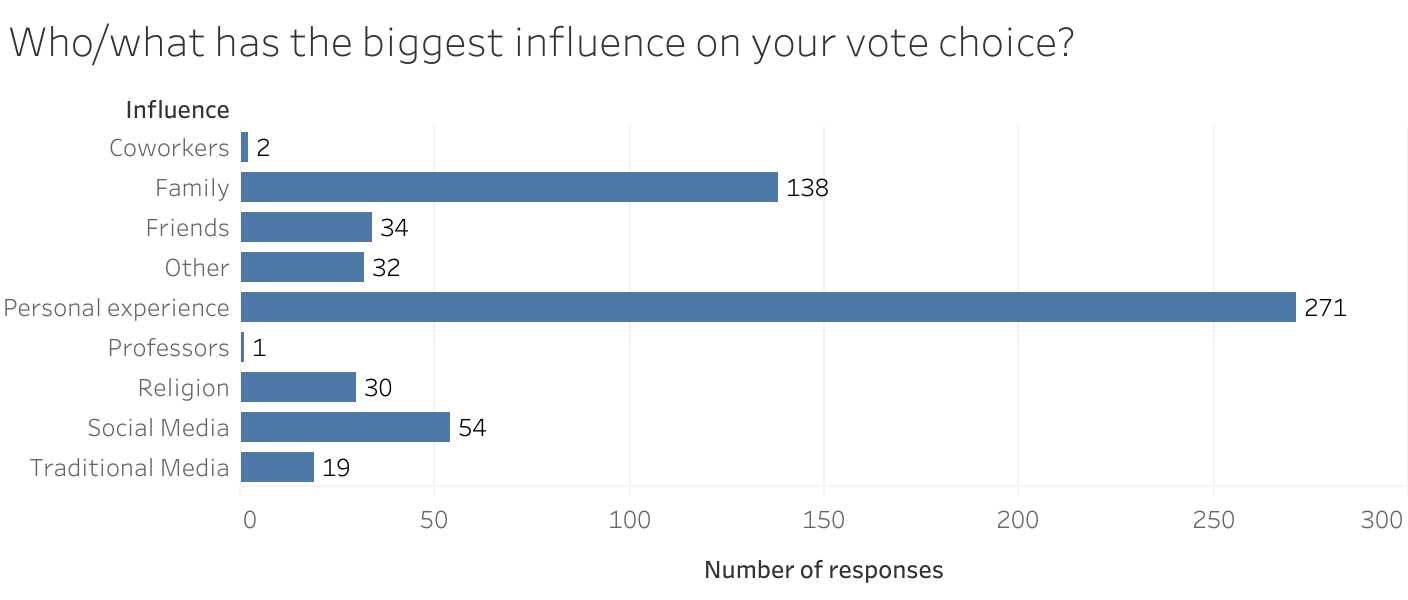
Most students say that personal experience has the greatest influence over their vote choice
Personal experience appears to hold the greatest influence over vote choice with Augustana students.
About 46% of students say that personal experiences shape their voting decisions the most, while 23% of students say that they are shaped by family and 9.3% by social media.
However, while personal experience influenced the majority of people who voted for Biden or Trump, students who voted for different candidates seemed to claim different influences over their vote choice.
About 12% of the respondents who supported Trump said that they were influenced by religion, while only 1% of Biden supporters said the same.
In contrast, Biden supporters were more likely to say they were shaped by social media and the traditional media than Trump supporters. Over 12% of Biden supporters said they were shaped by social media, and 4% said they were shaped by traditional media, while approximately 1% of Trump supporters cited social media as shaping them. No students who said they would vote for Trump said that traditional media was their main influence.
Students have a variety of reasons behind their choice of candidate. Exactly 33% wanted to vote against another presidential candidate, 23% said they like a candidate’s stance on social issues and 20.9% said they supported their all-around favorite candidate. More than 8% said they were voting for a candidate’s stance on economic issues, 6.4% said they were voting based on party affiliation and less than 1% said they were single-issue voters.
The majority of students who vote for Trump do so because he is their all-around favorite candidate. Over 37% of those who showed support for Trump claimed this as the reason behind their decision, while 27% said it was because of his stance on economic issues and 14% said they were voting based on party affiliation.
About 46% of the students who indicated support for Biden said they selected him to vote against a different presidential candidate, which would likely be Trump. More than 29% made the decision based on Biden’s stance on social issues and 4% selected “Other.”
One of the students who voted for the Green Party ticket said that they were doing so because they were a single-issue voter. Another did so based on party affiliation, and one marked “other.” About 30% of students who said they would vote on the Libertarian ticket did so because of their candidate’s stance on economic issues, while 30% also said they were voting for their all-around favorite presidential candidate and 20% were voting for the candidate’s stance on social issues.
Presidential debate had little impact on vote choice, but vice presidential debate solidified voter decisions
So far, there have been two debates held this year. The first took place between the two presidential candidates on Sept. 29, and the second took place between the two candidates for vice president on Oct. 7.
When asked how the first presidential debate influenced their presidential vote, 41% of students said it had no impact on their vote, while 36.7% said it solidified their vote. About 6% of students said the debate made their vote choices more uncertain, and about 6% said they were indifferent.
In contrast, 38.9% of respondents said the vice presidential debate solidified their vote choice, while 22.8% said it had no impact on their vote choice. 13.6% said while the debate had no impact on their vote choice, they wished the vice presidential candidates were running for president.
Most students remain concerned about the state of the United States. When asked their level of concern about the state of the nation with one being lowest and 10 being highest, just under 24% chose a 10, while 18% chose a nine and 20% chose an eight. Only 1.4% of respondents chose a one.
COVID-19 response, climate change and economy lead as top issues
When asked which issue was most important to them in the 2020 presidential election, 19.9% of respondents chose COVID-19 response. About 17% of students said climate change was most important to them, while about 14% of students chose the economy and 13.7% chose racial injustice. More than 10% of students chose healthcare, 6% chose reproductive rights and 2.6% chose the Supreme Court.
The majority of respondents believe the U.S. Senate should wait to confirm a new Supreme Court justice until after the 2020 election. Approximately 65% of students said the senate should wait, while 20% said that the Senate should move to confirm a nominee before the 2020 election.
About 80% of the students who said the Supreme Court nominee should be confirmed before election day also said they would vote for Trump. Just under 90% of those who say they should wait until after the election to confirm a nominee said they would vote for Biden. Only 3% of those who said they should wait until after the election supported Trump, and 4% of those who said the Senate should confirm the nominees before election day supported Biden.
“It looks like the majority are the parties aligning with whether they think that the nominees should go through or not, but there are some people who are on the fence or believe opposite of most of their constituents,” Widvey said.
About 53% of respondents disapprove of Donald Trump’s Supreme Court nominee, Amy Coney Barrett, to some extent. Over 33% of respondents said they strongly disapprove of the nominee, while 19.5% of respondents said they disapprove of the nominee. Just under 11% of respondents said they approve of the nominee, and 9% said they strongly approve of Barrett. More than 16% of students say they are unsure, and about 9% are indifferent.
Methodology and representation
An email with the Google Forms survey was sent to 1,646 students across campus. All responses were voluntary and anonymous.
The survey received responses from 35.8% of the student population. Students were asked questions about the 2020 elections and relevant political issues, along with several identification questions like academic year, gender identity, major(s), home state and ethnicity.
According to Widvey, the results seem to line up fairly well with the Augustana student population based on the answers to the demographic questions.
“I think it’s pretty representative of our population at Augustana when it comes to demographics,” she said. “But I think it would definitely help to get more people to fill it out.”
Women made up 69% of the poll’s respondents, while men made up about 27.9%. About 2% of respondents identified as non-binary, while 0.7% preferred not to answer and 0.3% marked other. According to information reported by the university, women make up 63% of the student population while men make up 47%.
Approximately 30% of respondents were fourth-year students, while 26.2% were in their third year, 20% were in their second year, 16% were in their first year and 4% were in their fifth year or higher.
Biology majors made up 18% of the sample, nursing majors accounted for over 13% and education majors made up about 11%. Business administration majors and government majors followed at about 7%.
Just over half of respondents were from South Dakota, while about 26% were from Minnesota, 7% were from Iowa and 6% were from Nebraska. More than 92% of respondents identified as Caucasian, while 2.6% of respondents identified as Asian, 2.2% identified as being Black or African and 2.9% identified as Hispanic/Latinx.
Yoder said it is difficult to gauge whether or not some of the demographic data, like political affiliation, was proportional because there are no university statistics to compare it with.
“That’s kind of why we’re doing the survey,” she said. “This is to get an idea of what our campus looks like. Obviously, when you’re getting admitted, you’re not asked ‘what is your political affiliation?’ So we can’t be positive that it is an exact representation, but we’re confident given how big the sample is that it is at least close.”